Docs › Admin › Admin: Audit, Observability & Enterprise
🏢 Admin: Audit, Observability & Enterprise
Full-stack audit logs, live metrics and tracing, and a built-in enterprise readiness console — all in one place.
Overview
Oryn gives admins and enterprise teams end-to-end visibility into what is happening inside the product and inside every workspace it touches. A structured audit log captures every state-changing API call — who did it, from which IP, how long it took, and which W3C trace ID links it to the distributed trace. A companion observability stack (Prometheus, Loki, Grafana, Tempo) provides real-time metrics, log aggregation, and distributed tracing across all Oryn services. On top of that, the Enterprise Module in the desktop app runs a suite of automated checks against any open workspace — readiness scoring, security scanning, Git safety, model routing, architecture diagramming, and parity analysis — so teams can prove and continuously improve their engineering posture without leaving the tool.
How it works
Every mutating API request on the Agent API passes through AuditMiddleware, which records the HTTP method, path, response status, duration, caller IP, and the W3C trace ID into a file-backed in-memory store — without ever blocking the response. The Workspace API's AuditController stores richer, tenant-scoped entries (org ID, user ID, action, resource type and ID, metadata JSON, IP) to a Postgres-backed audit_logs table and gates access with separate read and write bearer tokens supplied via environment variables. On the observability side, every .NET service exposes a /metrics endpoint that Prometheus scrapes every 15 seconds; structured logs flow into Loki via Promtail; and OpenTelemetry traces are sent over OTLP to Tempo — all visualised in five pre-built Grafana dashboards. The Enterprise Module in the desktop calls the EnterpriseController (running on the Agent API) to inspect the open workspace's files on disk: it classifies file types, runs regex-based security patterns, shells out to Git, and queries the ModelRegistry and ModelRouter — returning scored, structured results that are displayed in the dashboard grid.
What you can do
Structured audit log (Workspace API)Every write to /api/v1/audit stores org ID, user ID, action name, resource type and ID, metadata JSON, and caller IP to Postgres, queryable by org, date range, and action.
Automatic request audit (Agent API)AuditMiddleware intercepts every POST/PUT/DELETE/PATCH on /api/v1/* and persists method, path, status, duration, remote IP, and W3C trace ID without adding response latency.
Prometheus metrics + Grafana dashboardsFive pre-built dashboards (System Overview, Database Health, LLM & Tokens, Audit Activity, License Status) auto-load on stack start; Prometheus scrapes /metrics from every service every 15 seconds.
Log aggregation with LokiStructured logs from all services are collected by Promtail, stored in Loki, and searchable with LogQL — including filtering by org ID for tenant-isolated views.
Distributed tracing with TempoOpenTelemetry traces are emitted via OTLP (gRPC :4317, HTTP :4318) and stored in Tempo; each span is clickable in Grafana Explore and linked to the relevant Loki logs for side-by-side debugging.
Pre-configured alertingThirteen ready-made Prometheus alert rules (service down, high error rate, p95 latency, agent loop failures, Postgres/Redis health, license expiry, token spend spike, inactive customer) route to Slack and PagerDuty via Alertmanager.
Enterprise readiness checkScores the open workspace across 11 checks — workspace access, frontend/backend signals, tests, deployment files, data engineering signals, documentation, DevOps, agentic platform readiness, dependency manifests, Git, and registered models.
Security scanScans up to 3,000 source files for hard-coded secrets (private keys, AWS key IDs, generic token/password patterns), SAST patterns (SQL injection, eval/exec, disabled TLS), and security-tagged TODOs; findings are ranked Critical/High/Medium/Low.
Git safety checkVerifies the workspace is a Git repo, reports the current branch, dirty-file count, and enforces a policy that AI-driven edits should happen on a feature branch with a clean working tree.
Model router overviewShows all registered models and the task-to-model routing decisions (GeneralChat, CodeGeneration, CodeCompletionFim, Reasoning, LongContext, Vision, ImageGeneration, QuickReply) so admins can verify the right model is assigned to each task type.
Enterprise & feature parity matrixTwo scored checklists map Oryn capabilities (agents, editor, browser tests, terminal, cloud, Kubernetes, MCP, meetings, GitOps, enterprise controls) to actual product surfaces and surfaces any gaps.
Architecture diagram exportAuto-detects workspace components (UI, API, data layer, tests, cloud/IaC, security, integrations) and exports a Mermaid flowchart or a draw.io XML file that can be downloaded directly from the Enterprise tab.
Demo mode playbooksA library of named product demo flows (full-stack code generation, multi-agent workflow, oryn.build parity, security/compliance, meeting intelligence, etc.) loaded from the API for use in developer group walkthroughs.
Tenant-isolated observability viewsGrafana dashboards are parameterised by org_id variable; each customer org admin can log in via SSO and see only their team's activity, token spend, and compliance metrics.
How to use it
- Start the observability stack
Run START-OBSERVABILITY.bat (Windows) or the equivalent docker-compose command. This brings up Grafana on http://localhost:3000, Prometheus on :9090, Loki on :3100, Tempo on :3200, and Alertmanager on :9093. Log in to Grafana with admin/admin and change the password immediately. - Configure alert routing
Open observability/alertmanager/alertmanager.yml and set your Slack webhook URL and PagerDuty routing key. All 13 default alert rules are pre-loaded in observability/prometheus/alerts.yml. Test with a curl POST to the Alertmanager API to confirm delivery within 30 seconds. - Set audit API tokens
Set the ORYN_AUDIT_API_TOKEN environment variable on the Workspace API service. Optionally set ORYN_AUDIT_WRITE_TOKEN if you want a separate token for write access. All reads to GET /api/v1/audit must supply X-Oryn-Audit-Token; writes to POST /api/v1/audit must also supply X-Oryn-Audit-Write-Token. - Open a workspace in the Enterprise tab
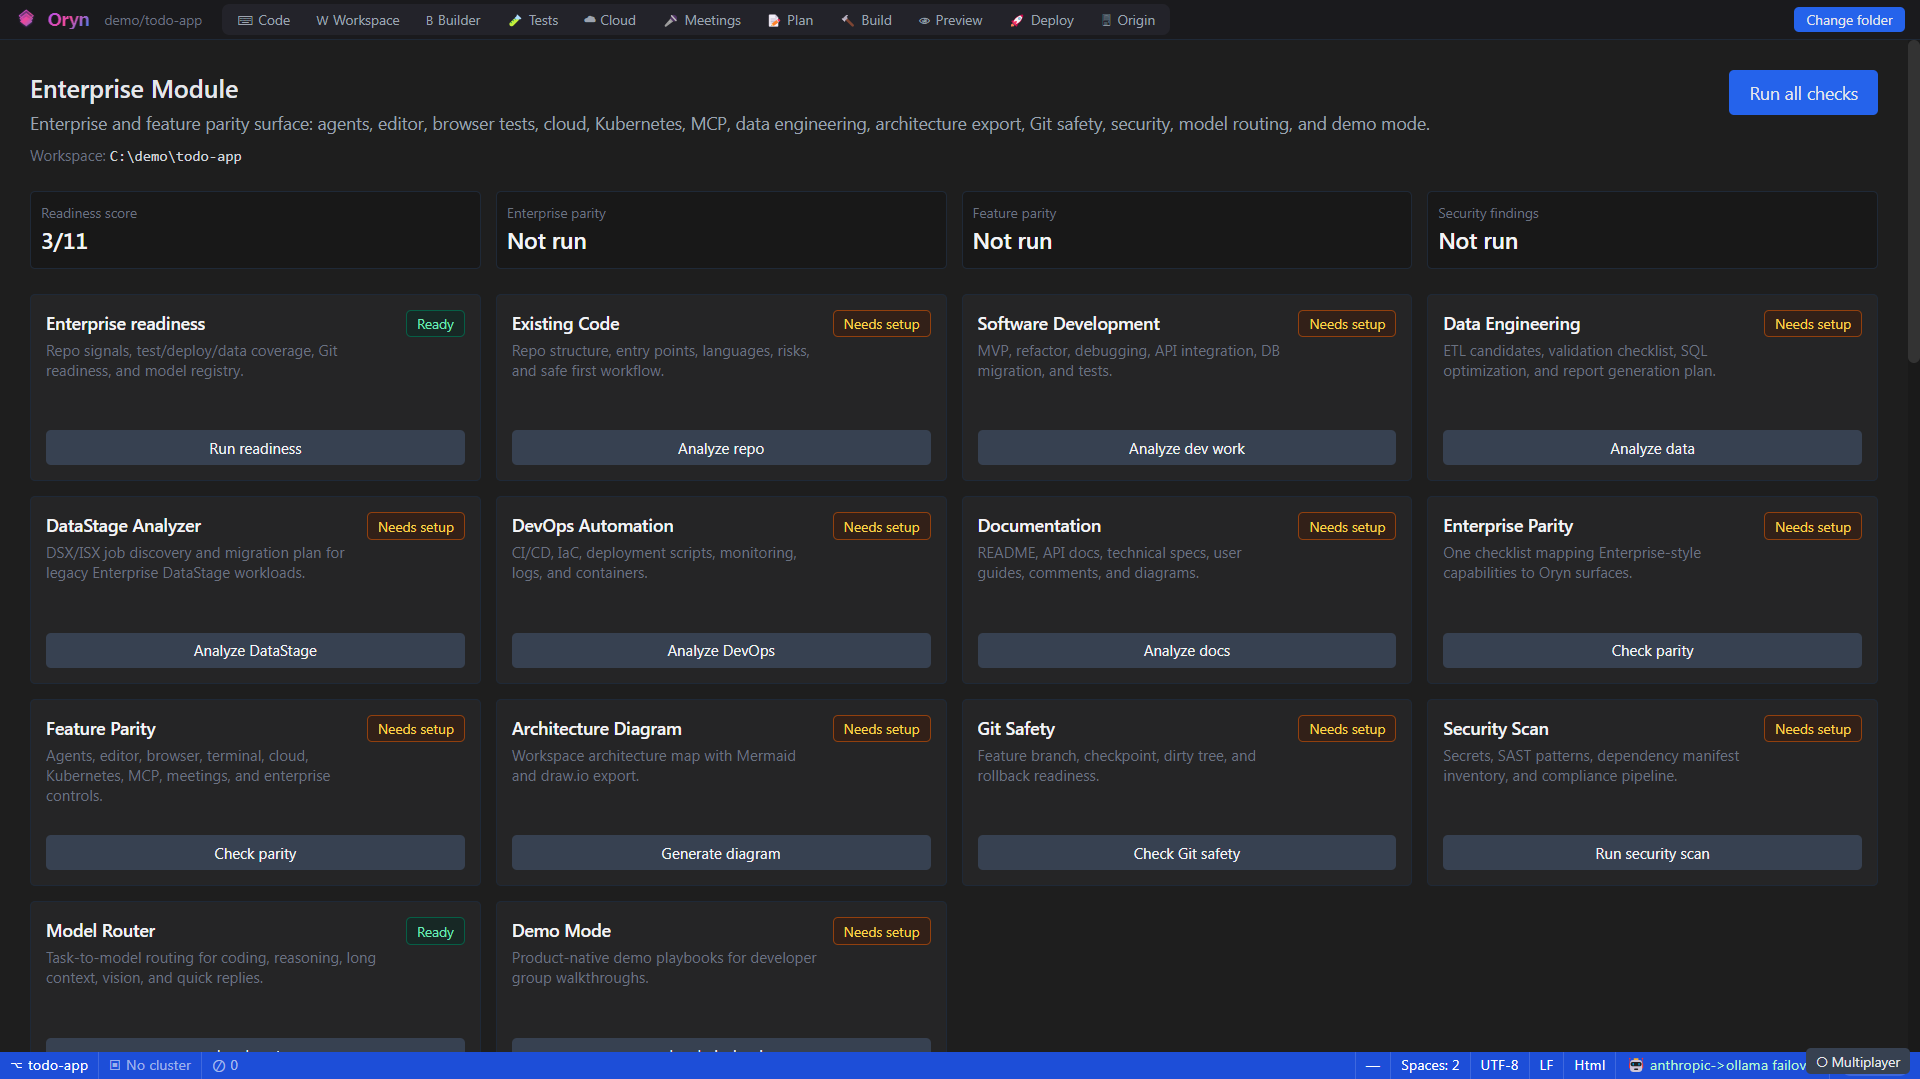
In the Oryn desktop app, open a project folder, then navigate to the Enterprise tab. The readiness check and model router load automatically. The dashboard grid shows 14 workflow cards, each with a Run button and a Ready/Needs setup indicator. - Run enterprise readiness
Click Run readiness. Oryn scans up to 4,000 workspace files and evaluates 11 checks. The readiness score (e.g. 9/11) appears in the header metric card and each check shows its status and detail in the readiness panel below. - Run a security scan
Click Run security scan. Oryn reads source files (skipping binaries, images, and files over 512 KB) and applies regex patterns for private keys, AWS access key IDs, hard-coded secrets, SQL injection, eval/exec, and disabled TLS. Findings appear sorted by severity (Critical → Low) with file path and line number. - Check Git safety before AI edits
Click Check Git safety. Oryn shells out to git to detect the current branch, dirty file count, and diff stat. If you are on main/master/prod or have uncommitted changes, the policy flags readyForAiEdits: false and suggests the commands needed to create a feature branch and checkpoint. - Inspect the model router
The Model Router panel loads all registered models and their task routes on startup. Use the task dropdown to select a task type (e.g. Reasoning) and click Route task to see which model is picked and the rationale returned by the router. - Query audit logs via API
Call GET /api/v1/audit?orgId={uuid}&from=2026-01-01&to=2026-06-14&action=file_write&limit=100 with your X-Oryn-Audit-Token header. The response is an array of audit log entries ordered newest-first, filtered to the specified organisation and time window. - Run all checks in one pass
Click Run all checks in the Enterprise tab header to execute all 14 workflows sequentially. When complete, every panel populates and the four header metrics (Readiness score, Enterprise parity, Feature parity, Security findings) update together.
Example
A security-conscious admin opens a fintech repo in Oryn and wants to confirm it is safe to let the AI agent make edits. They click Run security scan. Within seconds the scan reports 2 Critical findings (a PEM private key in a test fixture and a hardcoded API key string) and 1 High finding (a disabled TLS validation callback). The findings panel shows the exact file path and line number for each issue. The admin fixes the secrets, then clicks Check Git safety — it confirms the team is on a feature branch with a clean working tree, so readyForAiEdits is true. Finally they click Run readiness and see a 10/11 score: everything passes except deployment files, which they note as a follow-up task. With all checks green, they proceed to request a scoped AI edit in the Code tab, confident the baseline security and workflow posture is sound.
Admin notes
Audit API access is token-gated via environment variables (ORYN_AUDIT_API_TOKEN for reads, ORYN_AUDIT_WRITE_TOKEN for writes). If ORYN_AUDIT_API_TOKEN is not set or the supplied header does not match exactly, all audit endpoints return 401. All audit queries are also tenant-scoped: a request with a mismatched org ID is rejected with a tenant mismatch error, so cross-organisation data leakage is prevented at the controller level. The AuditMiddleware on the Agent API uses a fire-and-forget write so audit recording never delays API responses, but this means audit entries could be lost if the process crashes before the async write completes — the Workspace API Postgres table is the authoritative long-term store. For compliance retention requirements (e.g. 7-year mandates), rely on the Postgres audit_logs table, not Loki (which defaults to 30-day retention). Log and trace retention can be adjusted in observability/loki/loki-config.yml (retention_period) and the Tempo configuration. For cloud deployments, Prometheus ServiceMonitor is included in the Helm chart and auto-discovers Oryn pods; cloud-native log sinks (Azure Monitor, CloudWatch, Cloud Logging) can be enabled via Helm values. An EFK/ELK alternative is documented and provided for customers with existing Elastic deployments, but requires 6-8 GB RAM versus approximately 2 GB for the default PLG stack. Change the default Grafana admin/admin credential before going to production.
Related